As part of the Niagara Network Partner Showcase series, we introduce our partner’s solution and elucidate the optimization and added value achieved by combining Niagara’s and our partner’s offering together.
In this blog post, we describe the challenges that arise when troubleshooting large networks and present a new analyzing tool to overcome them. Allegro Packets tool is offered as part of the Niagara Network next-generation Network Packet Broker together with the PacketronTM solution. In part two, we'll discuss how the Niagara Networks packet broker can be utilized to maximize the benefit and value of network analysis tools for users.
No company can work without a running network
Optimizing and troubleshooting modern IT architectures often takes significant effort due to their heterogeneous structures. The sources of errors and bottlenecks are complex and fixing individual problems is time-consuming and therefore cost-intensive. Most of the time networks grow together with the company,therefore many legacy services are still in use while other newer and more modern services are introduced and running on the same network. This creates additional challenges when those services need to communicate with one another.
What are the difficulties in troubleshooting large, heterogeneous networks?
Firstly, the available and used bandwidth continuously increases with advances in technology. Nowadays, client devices are connected via gigabit ethernet and multiple 10 gigabit connections. Sometimes we even see 40 gigabit connections being used to connect offices with servers, or to virtual machines to the internet. But with all these connections comes the need for effective network visibility. Often, customers need multiple tools to monitor and troubleshoot issues that arise over the network. Sometimes tools and devices used for testing physical connections can only check a single 10 gbit connection and show limited insight into real-time network traffic.
There are other cases where an additional tool is used to actively scan for the network structure and topology to display which services are running at which location. And in other cases, even more powerful tools are required to look deeply into individual packets but often these tools may not be capable of analyzing multiple 10 gbit links in real-time.
The second problem in troubleshooting networks is the size of the network and the number of connected devices. Thousands of IP addresses can be active within a network, a challenge that is exacerbated with the digital transformation introduced by IoT and BOYD, where every smart device has at least one IP address. The network analysis tool must be able to efficiently manage large numbers of IP addresses and identify problems within the network.
Conducting network traffic analysis from such extensive networks with tools like Wireshark, can be extremely time-consuming as vast amounts of multiple gigabytes of data need to be analyzed. On the one hand filtering and sifting through the traffic takes a lot of time, while on the other hand, selecting only a single IP address can ‘hide’ problems. For example, sometimes we may witness a service experiencing slow response time, but the cause is associated to other unrelated prioritized traffic happening at the same time.
All these issues require a tool that can handle a large amount of traffic while providing in-depth network visibility and monitoring. The Allegro Network Multimeter meets those challenges that IT architects face today.
Allegro Network Multimeter - An all-in-one
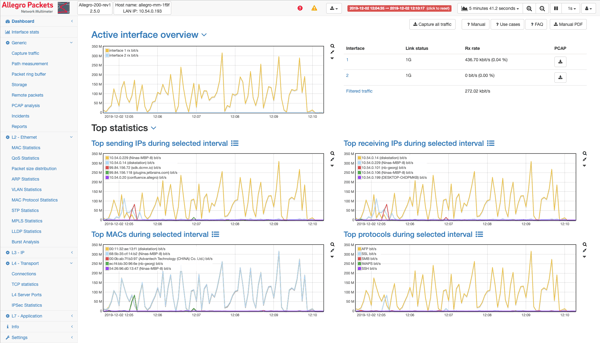
It is an all-in-one tool that measures, displays and analyzes all metadata from Layer 2-7. Another unique capability, much sought after by network engineers, is that it analyzes and displays this data in real time. This applies to both live data and past (captured) network traffic. It is so powerful that it can even analyze data rates of up to 100 gigabits per second in real time.

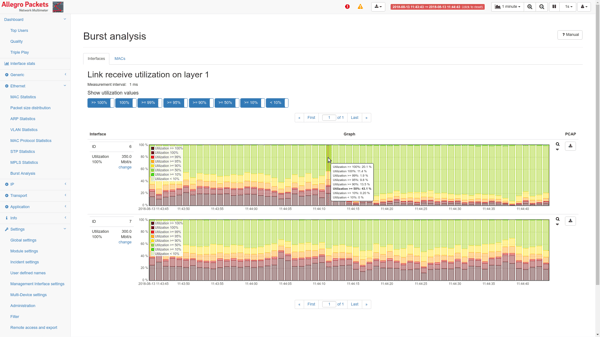
The Allegro Network Multimeter eliminates the need for many previously redundant network analysis tools. Network traffic visibility is clearly displayed via a web interface. From there, you navigate to the detailed analysis modules which are structured according to the OSI layer model making them easy to find. It also supports the network administrator, for example, in investigating various aspects of an error situation. The user can start from a particular IP address and monitor contacted peer addresses, or drill down from a high level view.

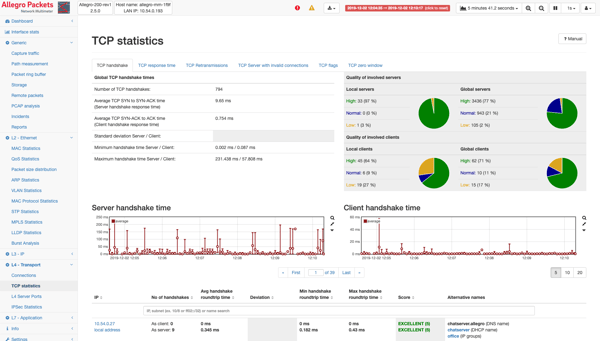
Using the Allegro Network Multimeter, you can quickly and easily move between the different layers of network analysis, from VLAN/MPLS over IP to TCP/UDP and the application layers above. At each level, detailed measurements are available both per peer (IP, MAC) and as a general overview in order to isolate and locate an error. Another advantage is the ability of working with other third-party tools. For example, one-click captures can be created for all or filtered traffic. Users can then open captured files in Wireshark or other tools for deeper packet inspection.
Detailed real-time statistics on high-throughput networks makes it easier to analyze network problems and solve performance bottlenecks more cost-effectively and promptly than when using multiple tools on the different network layers.

Allegro Network Multimeters are powerful yet easy to use diagnostic appliances for network analysis. They are used by network administrators to monitor and acquire highly granular real-time and historical network traffic.
The Allegro Network Multimeter can be used in a range of scenarios including Analysis of WebEx quality issues, identifying sporadic malfunctions of the server connection, creating a packet capture to diagnose a network malfunction and much more.
To learn more about how to address your network troubleshooting and analysis needs, talk to a Niagara Networks specialist or with a representative from Allegro Packets.

 By: André Vink & Klaus Degner